What do my Students Test Scores Mean? - Interpreting the data and when to get help

Stephanie Tsapakis
|
Published on Nov 29, 2022 · 4 min read


Stephanie Tsapakis
|
Published on Nov 29, 2022 · 4 min read

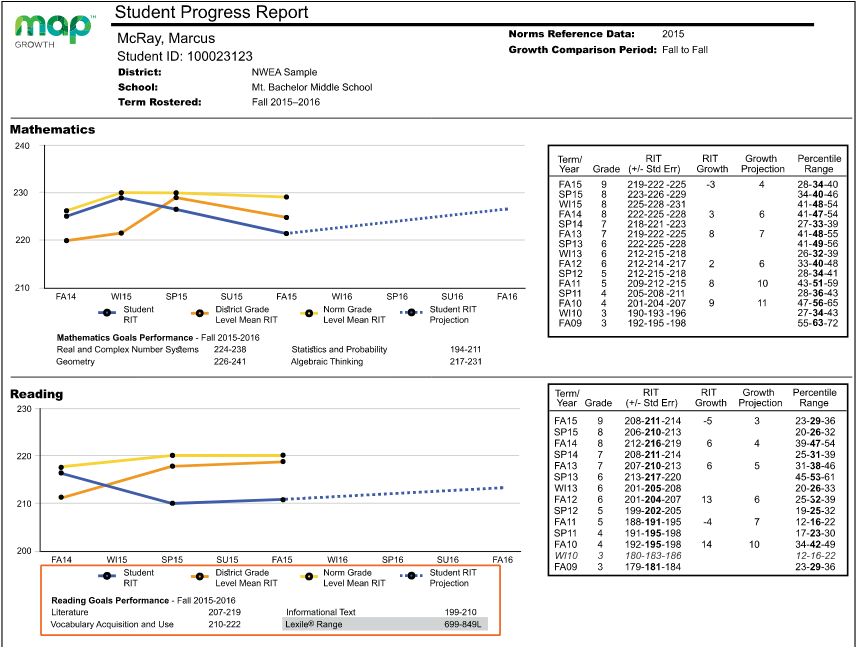
Three times per year, our local schools administer the MAP test. We are given a report similar to the one below:

(image from mapnwea.org)
If the picture above makes you scratch your head, you are not alone. Schools administer all types of assessments to our students - standardized, formal, informal, formative, summative - and the results of those assessments are often confusing to parents.
In order to truly understand test results, the first thing to understand is the difference between the various forms of assessment.
This is a type of test with predetermined questions and specific score possibilities. These assessments are also administered in a consistent manner, such as on the computer (which is most often the case these days). Scores are compared to other scores of students in a similar “group” (usually age or grade) based on the average score of all students who have taken the test. Before these assessments are widely used, lots of data is collected by testing companies in order to figure out what the average score is, and how students will compare to same-aged peers.
These tests are a way to measure progress and understanding based on non-standardized tests. Things like teacher observations, projects, or other data collected from a student, typically collected through the teacher. These types of assessments are usually more personalized, which means that they can also be influenced by bias or judgment.
Pop quiz time! Formative assessments are lower-stakes assessments to inform instruction. When a teacher wants to know if the class is ready to move on to the next chapter, they typically give a formative type of assessment - often a quiz. These are typically used as progress monitoring along the way at various parts of a unit of instruction so that a teacher can understand if their students are mastering the material or not.
Think of unit assessments or semester exams. Summative assessments are a longer type of assessment usually given at the end of a unit, or end of a semester, covering information from the entire unit(s) of study.
The first question you will ask yourself when interpreting test results is what kind of assessment was given to your student.
These types of assessments are usually relatively straightforward. They typically have a grade associated with them, and each question has a specific point value. If a student is struggling on these assessments, it usually means they are having trouble understanding the material being taught.
Of course, there are other factors such as test anxiety, testing environment, and ability to read and understand test questions. If you are seeing low grades on these types of assessments regularly, it is best to reach out to your child's teacher for additional data such as their observations about your child's understanding via class discussions and other independent work.
This is usually where parents get confused, but it is easier than you think to understand these results.
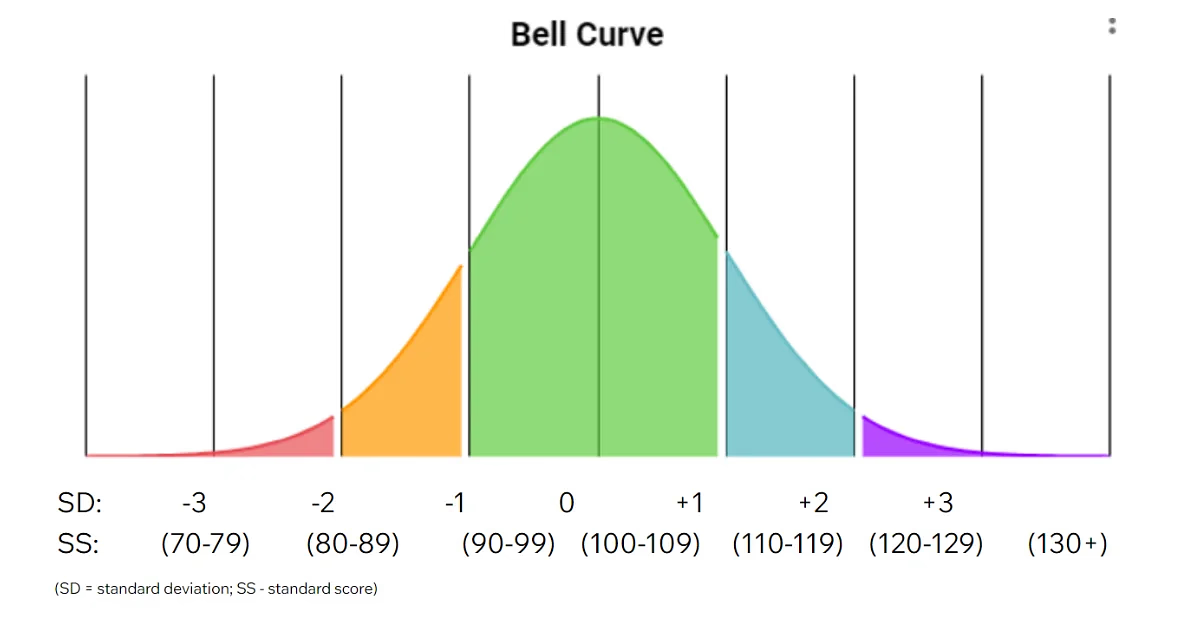
Since standardized assessments are based on scores of a standard group, they are reported based on their relationship to the mean - or the average score of the group. This is most easily explained by the Gaussian Bell Curve:

In the above image, the mean is represented by the middle line or the number 0. This is thought of as the average score, or totally normal compared to the rest of the group. Anything in green also represents average; and includes anything within one standard deviation away from the mean. (A standard deviation is how we describe how far a score moves away from the mean.) The part of your score report showing "Standard Score" should have numbers between 90-110 (sometimes 85-115). Your child could be scoring a bit lower, or a bit higher than the mean score and still be considered within the normal range. A standard score of 100 means the child's score is the same as the mean (average).
As we move more than one standard deviation away from the mean, we get into scores that are outside the average range. The orange color shows the area qualified as being "below average" or more than one standard deviation below the mean (in other words, further away). The part of your score report showing "Standard Score" should have numbers between 80-89 (sometimes 70-85).
The red area would be qualified as " well below average" or more than two standard deviations away from the mean. If you are seeing your students' scores fall in this part of the bell curve picture, or scores that are 79 (sometimes 75) or below, this would be an indication that they are struggling.
On the other side of the mean would be the above-average scores. Anything with a standard score of 110-119 would fall in the blue area, and be classified as "above average". Anything in the purple area with a standard score of 120 and higher would be classified as "well above average". Scores in these ranges would indicate a student is scoring better than the majority of their peers on these standardized assessments. These scores also fall one or two standard deviations away from the mean, meaning they move in another direction away from the average of the group.
When reading standardized assessment reports, most scores will be reported as percentile ranks. Many parents are confused by what this means, and we would like to simplify that for you!
For example, if your child is scoring in the 55th percentile, this would put them just a bit above the mean. It also means that they are scoring better than 54% of their same-aged peers, and lower than 45% of their peers. If your child is in the 90th percentile, that would mean they are scoring better than 89% of same-aged peers, and only 9% of peers are scoring higher.
MAP tests typically send home two different scores on their reports. One is a growth score, and one is an achievement score. Both scores will typically have a RIT number associated with it, and also a percentile score. The RIT score is the number of points a student earned (but you will not know the total number possible, so this is kind of meaningless for parents).
Many parents often ask, “What is a good MAP test score?”, but it is not that simple. The actual RIT scores change from grade to grade and from testing period to testing period. I highly recommend you pay little attention to the RIT score and focus more on growth and achievement.
Growth scores are just what they sound like - the amount of growth a student showed from one testing period to the next. If your student took the test at the beginning of the school year and then again in the winter, their winter growth score will show how much improvement they made. These scores will also have a percentile associated with it, but it is NOT the same as most percentiles and standardized scores. The percentile associated with the achievement score compares the amount of improvement your child made to the amount of improvement made by same-aged peers across the country.
It is important to remember that students who are already high-achieving students will likely have lower growth scores. Basically, if you are already at or near the top, there is not much more room for improvement.
This is where I focus most of my attention. Achievement scores will show how your child’s actual achievement is compared to same-age peers. These scores are more similar to standardized scores on tests that would be administered by school psychologists and neuropsychologists.
To understand this score, please refer to the previous section in the blog that explains the bell curve.
Remember, standardized tests and even other types of assessments are just a snapshot of your child’s learning. We all have bad days, and many factors could influence our scores (amount of sleep, late arrival to school, stress, or lack of interest are just some examples).
Context is always important when considering test scores. You can use test scores to help you understand your child’s emotional well-being in addition to their ability to master new concepts. You could also learn whether they are struggling with one specific subject or across all areas. Test scores can help you understand if and how your child is struggling and whether or not they may need additional help.
We hear it a lot in our consultations with families, a parent saying they just "KNEW" something was off, but the school kept telling them to wait before getting additional help. (Expert tip: Don't wait. Trust that gut!)
It is important to understand that there could be a variety of reasons why a student scores low on any single given test. However, if a student is showing a pattern of weaknesses in a specific area, then it is important to seek intervention and additional support. There are multiple signs of learning difficulties, and test scores can give you concrete data to back them up.
If your child is scoring in the below-average or well below average range, or you’re noticing consistent scores under 85 on standardized tests, it’s a clear sign they might need some extra support. Even informal assessments or school tests coming home can tell you a lot. One low grade? Not a big deal. But if it starts happening often, that’s your cue to take action.
Start by talking to the teacher and getting their take. But if they suggest “waiting and watching,” trust your gut, don’t wait. You can also explore private intervention, like what we offer at LD Expert, to give your child the tools they need to thrive and feel confident in school again.
Note: Standard deviation calculations will vary from test to test. Typically, they will be in increments of 10 or 15.
Looking for personalized support for your child's learning journey?
Our tutoring and dyslexia intervention services are tailored to students with learning differences. Whether it's reading, writing, or other challenges, our team offers one-on-one guidance.
Start with a consultation!Answers to frequently asked questions
Standardized scores show how your child performs compared to other students nationwide. They highlight strengths and areas needing improvement, but don’t reflect all aspects of learning.
Not necessarily. One test score is just a snapshot. If there's a consistent pattern across tests or subjects, it might be worth discussing with the teacher or a specialist.
Look for repeated low scores in the same subject or skill area. Also, if your child is struggling with schoolwork or frustrated at home, it’s a good time to seek support.
Percentile ranks compare your child to peers (e.g., 60th percentile means they scored better than 60% of students). Grade-level scores show whether they’re meeting expected skills for their grade.
Start with your child’s teacher or school counselor. If concerns continue, consider an educational consultant, learning specialist, or assessment expert.
Stay updated with our latest blog posts.
Cart